Visualisation & Analysis on Namma Yatri Data Using Power Bi | Realcode4you
- realcode4you
- May 21
- 6 min read
Namma Yatri Analysis – Technical Methodology
Objective
Analyse Namma Yatri ride data to uncover demand, revenue and cancellation patterns
Evaluate operational efficiency across time periods and zone
Calculate and visualize each duration’s contribution to total revenue
Understand how total fare varies by hour of the day.
To highlight top-performing pickup zones based on search volume
To understand hourly demand patterns and temporal ride distribution across zones.
Understand Cancellation rates by Assembly
Translate insights into data-driven recommendations for improved resource allocation and user experience
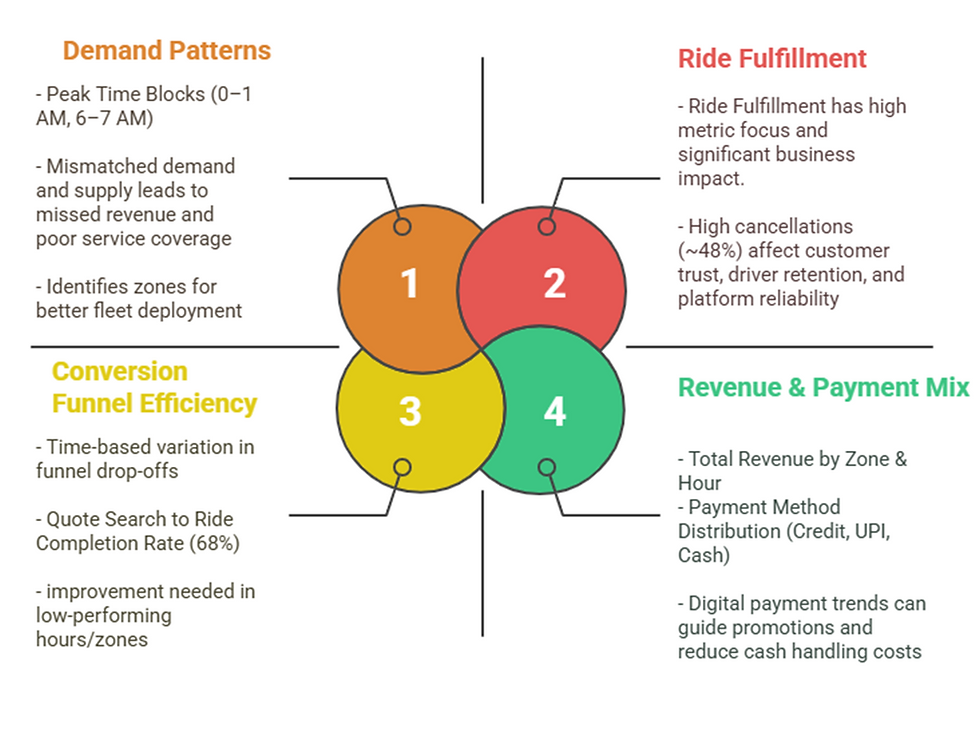
AGENDA
Problem Statement
Why this analysis needed
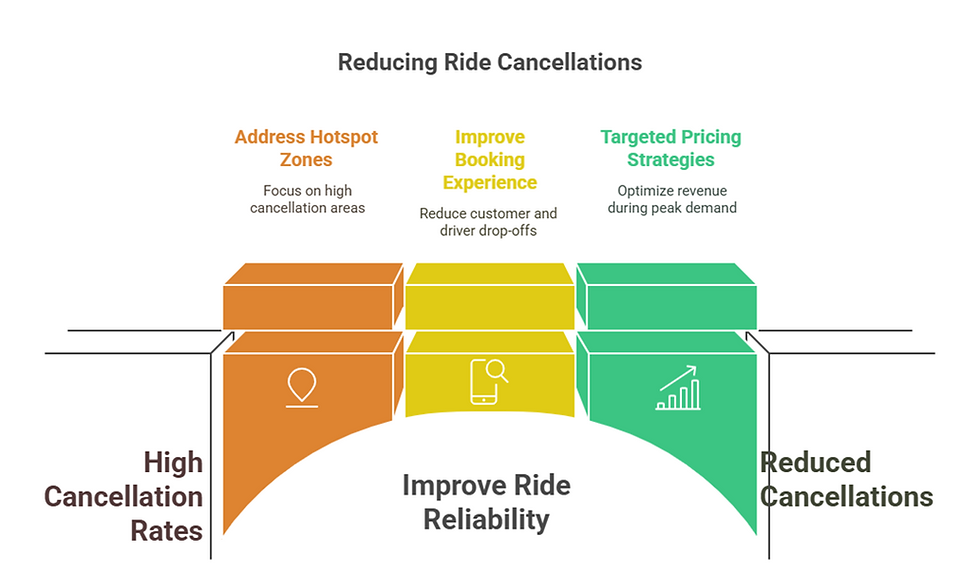
High Cancellation Rates Impacting Revenue
Mismatch Between Demand & Driver Availability
Underutilized & Low-Performing Zones
Conversion Funnel Drop-offs
Inconsistent Ride Experience Across Locations
Need to Improve Efficiency & Retention
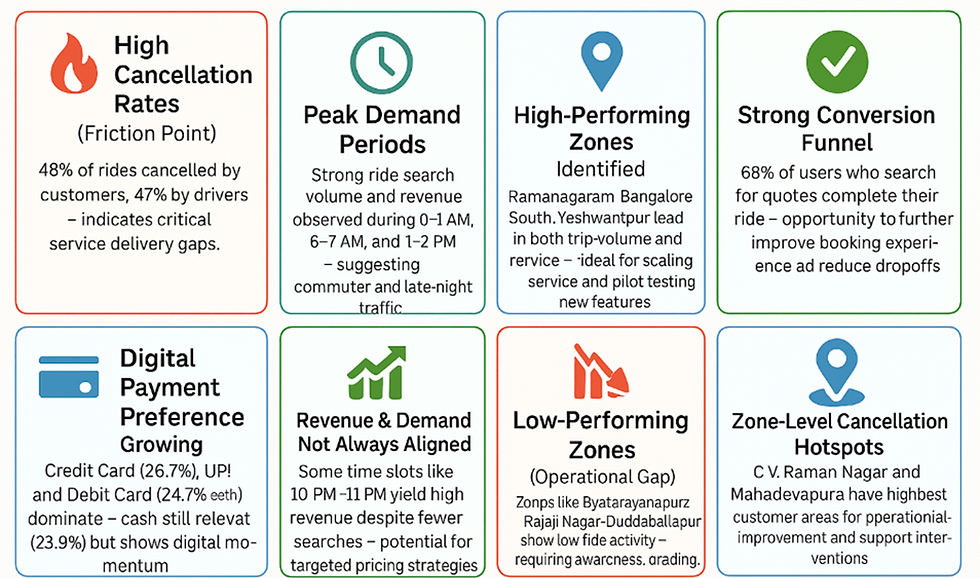
Executive Summary - Purpose: A quick overview for decision-makers
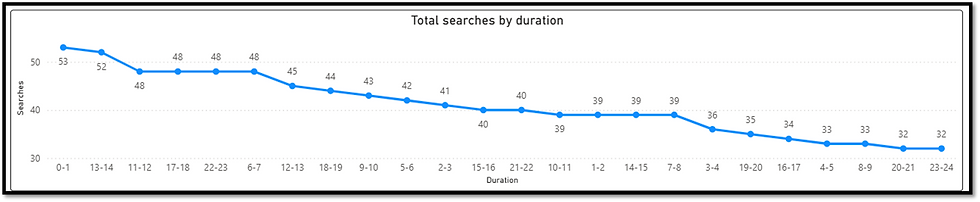
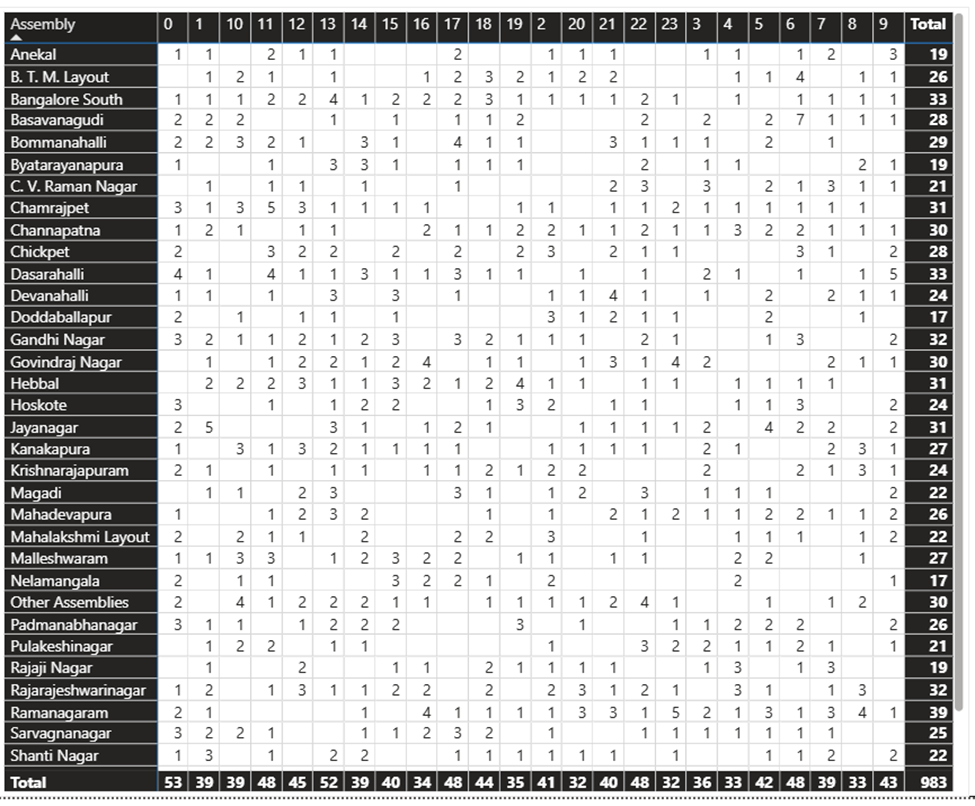
Ride Demand Over Time
Key Insights:
Peak Hours:
Highest ride searches during 0–1 AM (53) and 1–2 PM (52)
Indicates strong demand late at night and post-lunch hours
Steady Midday Demand:
Moderate search volume (39–48 searches) between 10 AM–3 PM
Low Demand Periods:
Evening to late night (8 PM–12 AM) shows dip in demand (~32–33 searches)
Overall Trend:
Demand peaks early, dips post-afternoon, and drops again after 8 PM
Recommendations:
Optimize Driver Shifts:
Prioritize availability during late-night (0–2 AM) and early afternoon spikes
Targeted Promotions:
Run fare discounts during evening slowdown (4–7 PM) to stimulate demand
Data-Driven Scheduling:
Align dynamic pricing and fleet deployment with observed hourly patterns
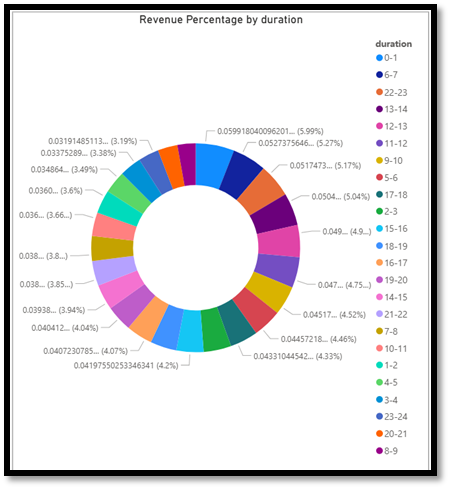
Revenue From Different Duration
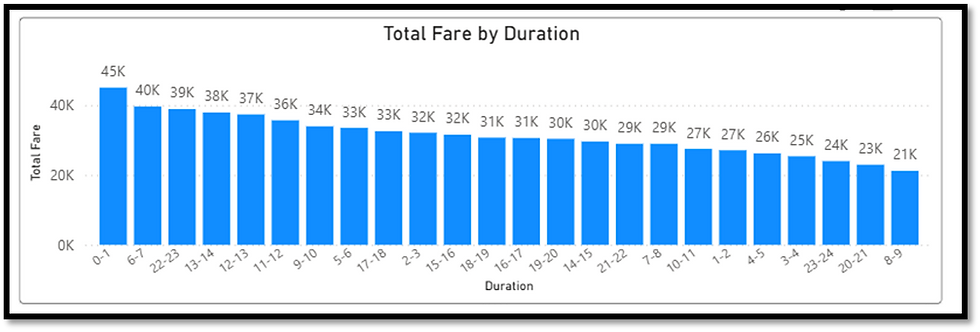
Key Insights:
Top Revenue Time Slots:
0–1 AM: Highest share (~5.99%)
6–7 AM: ~5.27%
10–11 PM: ~5.17%
1–2 PM: ~5.04%
Stable Revenue Spread:
Most slots contribute between 3.8% to 4.7% of daily revenue, showing consistency across time
Lowest Revenue Hours:
8–9 AM: Only 2.82% — lowest contributor
Other low slots include 3–4 AM (3.38%), 8–9 PM (3.05%), 11 PM–12 AM (3.19%)
Recommendations:
Boost Midnight & Morning Operations:
Increase driver presence and apply surge pricing at 0–1 AM and 6–7 AM to capitalize on revenue potential
•Apply Dynamic Pricing:
Adjust fares or offer targeted promos in low-revenue slots to stimulate demand and optimize margins
Invest in Late-Night Ride Experience:
Given revenue strength at night, improve safety, reliability, and driver availability during these hours to build user trust.
Payment Methods By Customer
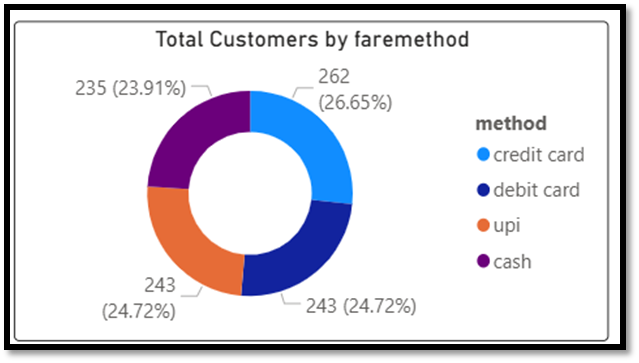
Trends & Patterns:
Digital Dominance:
~76% of customers use non-cash payment options (credit, debit, UPI)
Even Distribution:
All methods are actively used, with only slight variation in preference
Cash Matters:
Still important in cash-preferred areas or for digitally limited users
Recommendations:
Promote Digital Payments:
Offer cashback, loyalty points, or in-app rewards for UPI and card transactions
Preserve Cash Flexibility:
Continue supporting cash for inclusivity, especially in certain zones
Explore Loyalty Linkage:
Track if digital payers ride more frequently and tailor offers accordingly
Relationship Between Trip Hour & Revenue
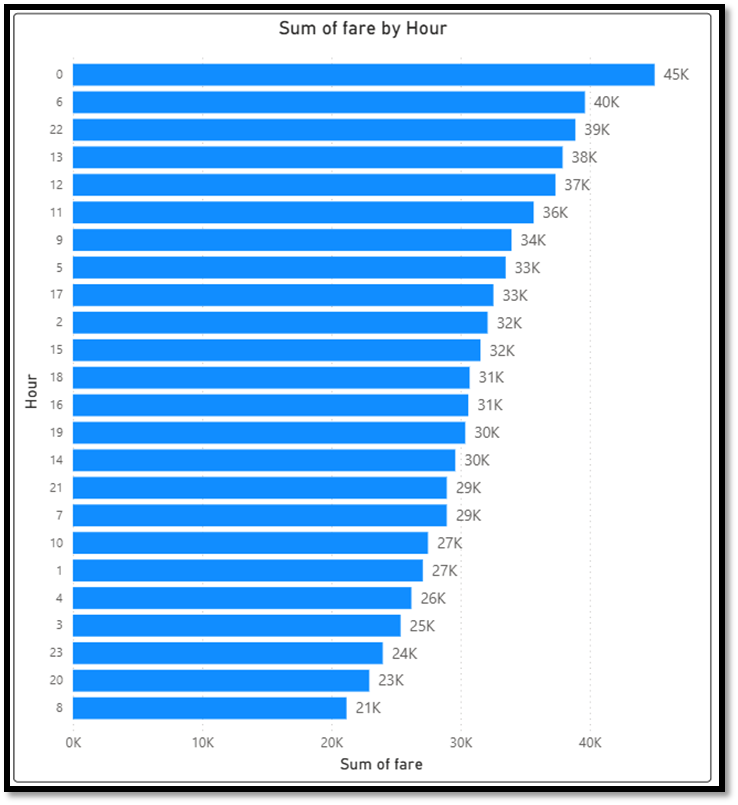
Observed Patterns:
Midnight Spike: May reflect post-event and nightlife rides
Morning Peak: 6:00 AM revenue indicates strong commuter activity
Evening Lift: 10:00 PM rides suggest entertainment or home-return usage
8:00 AM Dip: Possibly due to high volume but lower fare (short-distance) trips
Recommendations:
Surge Pricing & Incentives: Maximize revenue during 0:00, 6:00, and 22:00 by boosting driver supply and fare multipliers
Targeted Discounts in Low-Revenue Slots : Offer off-peak promotions at 8:00 AM and 8:00 PM to increase usage
Event-Based Campaigns: Launch time-specific marketing (late-night events, post-work travel) to capture high-value traffic
High Performing Zones
Key Insights:
Top Zones by Ride Requests:
Ramnagar: ~39 searches
Bangalore South: ~36
Gandhi Nagar: ~33
Hebbal & Chamrajpet: ~31 each
These zones show consistently high search activity - indicating strong user demand
Clear lead over other areas, suggesting regional clusters of frequent ride requests
Recommendations:
Expand Fleet in High-Demand Areas:
Improve vehicle availability in Ramnagar, Bangalore South, and Hebbal to capture unmet demand
Use Dynamic Pricing & Zone-Based Promotions:
Apply surge pricing during peaks and offer discounts in off-peak hours to balance demand
Partner with Local Businesses & Transit Points:
Enhance pick-up/drop-off infrastructure and offer ride deals for shoppers and commuters
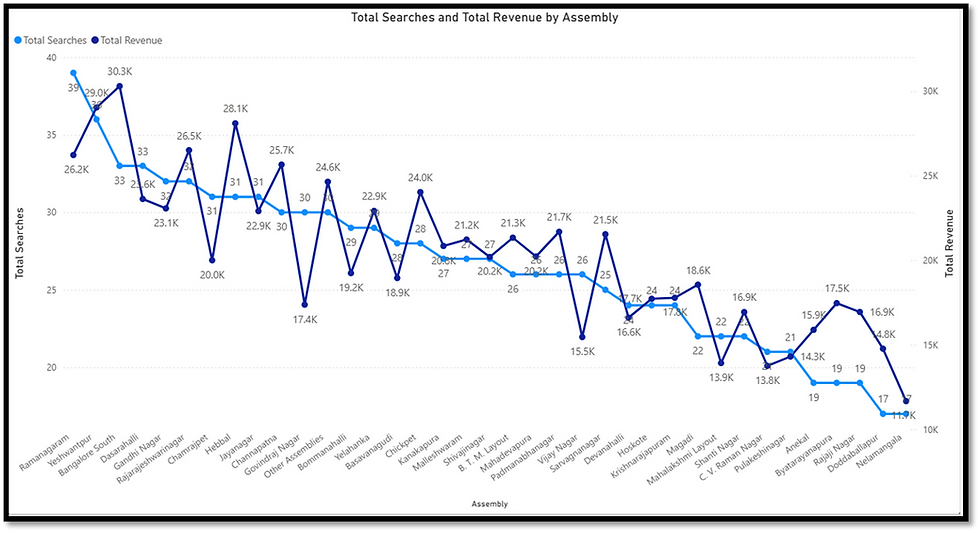
High Revenue Performing Zones
Trends & Contributing Factors:
High Fare Rides: Longer trips or premium fare services common in zones like Bangalore South & Gandhi Nagar
Affluent or Commercial Areas: Higher spending customers increase per-ride revenue
Better Ride Completion Rates: Reliable driver availability and service coverage drive consistent revenue.
Key Insights:
Top Zones by Revenue:
Bangalore South: ₹30.3K
Ramnagara: ₹29.0K
Gandhi Nagar: ₹28.1K
Jayanagara: ₹25.7K
Chamarajpet: ₹24.6K
These zones consistently generate high earnings, even when not leading in ride request volume
Business Recommendations:
Deploy Premium Services in Top Zones:
Introduce high-comfort or XL vehicle types in Bangalore South, Ramnagara
Launch Loyalty Plans:
Offer subscriptions or cashback incentives for frequent riders in high-revenue zones
Grow Revenue in Mid-Tier Zones:
Target areas like Hebbal with ride bundles or promotional pricing to uplift average fare value
Ride Across Different Time Zone
Top Performing Zones
Assembly | Total Rides |
Ramanagaram | 39 |
Yeshwantpur | 36 |
Bangalore South | 33 |
Dasarahalli | 33 |
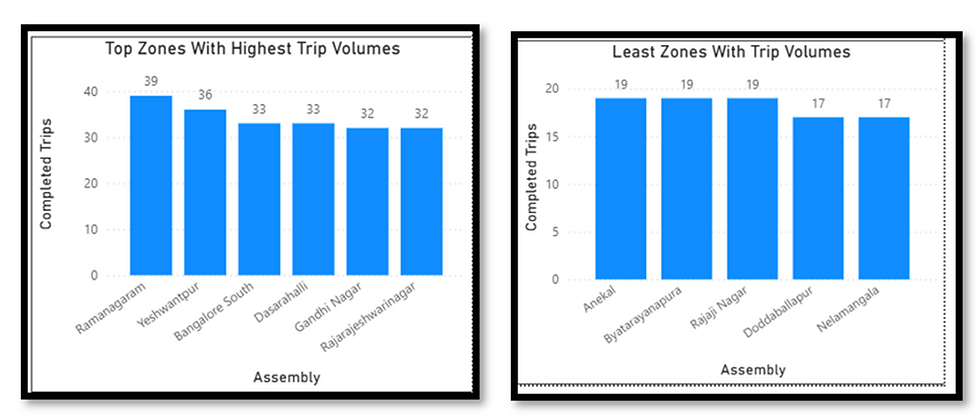
Low Performing Zones
Assembly | Total Rides |
Byatarayanapura | 19 |
Rajaji Nagar | 19 |
Doddaballapur | 17 |
Nelamangala | 17 |
Time Slot | Observed Pattern |
0–5 hrs | Very low activity across all zones |
6–9 hrs | Morning commute spike in top-performing zones |
10–15 hrs | Midday demand driven by zones like Yeshwantpur |
16–20 hrs | Evening peak in nearly all zones |
21–23 hrs | Drop in low zones, steady in top zones |
Business Recommendations
Optimize Driver Allocation:
Increase availability in Ramanagaram, Yeshwantpur, Bangalore South during 6–9 AM & 5–9 PM
Stimulate Demand in Low Zones:
Run midday promotions in zones like Byatarayanapura and Rajaji Nagar
Service Review for Lowest Zones:
Evaluate feasibility or enhance visibility in Doddaballapur and Nelamangala
Top Zones With Highest Trip Volumes
Assembly | Completed Trips | |
1 | Ramanagaram | 39 |
2 | Yeshwantpur | 36 |
3 | Bangalore South | 33 |
4 | Dasarahalli | 33 |
5 | Gandhi Nagar | 32 |
Key Drivers of High Trip Volumes:
Urban Density:
High residential and commercial population drives consistent mobility demand
Balanced Land Use:
Dasarahalli and Gandhi Nagar combine residential, business, and public facilities
Transit & Commercial Hubs:
Zones like Yeshwantpur and Bangalore South support metro stations and markets, boosting short-distance ride frequency
Business Recommendations:
Driver Optimization:
Prioritize driver presence during peak hours in top zones to reduce cancellations and wait times
Marketing Focus:
Run referral/loyalty campaigns in these high-demand areas to increase retention
Pilot New Services:
Launch ride-pooling or express ride features in top-performing zones like Ramanagaram and Bangalore South
Ride Cancellations vs. Completions
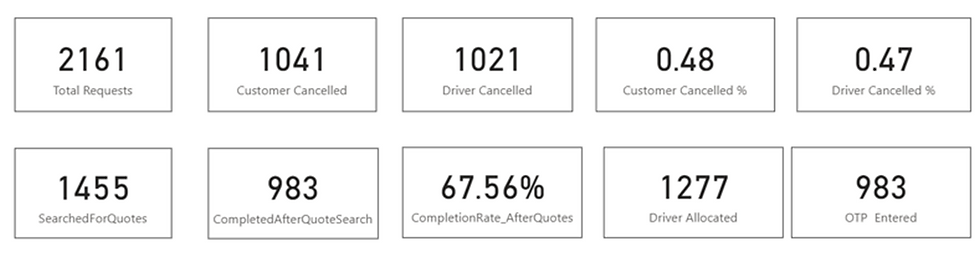
Metric | Value |
Total Ride Requests | 2,161 |
Customer Cancelled | 1,041 |
Driver Cancelled | 1,021 |
Customer Cancelled (%) | 48% |
Driver Cancelled (%) | 47% |
Customer Success (%) | 52% |
Driver Success (%) | 53% |
High Cancellation Rates:
Nearly half of ride requests result in cancellations by either customers or drivers
Underlying Causes May Include:
Long wait times, low driver availability
Surge pricing or payment failures
Pickup mismatch or customer readiness issues
Data Scope:
Analysis is based on raw Trip_Details to reflect full ride request activity (not just completed trips)
For performance KPIs, cleaned data (joined with Trips) is used
Business Implication:
These high drop-off rates signal major operational friction
Improving ride confirmation and reducing cancellations can directly boost revenue and customer satisfaction
Ride Vs Customer Cancellation by Assembly
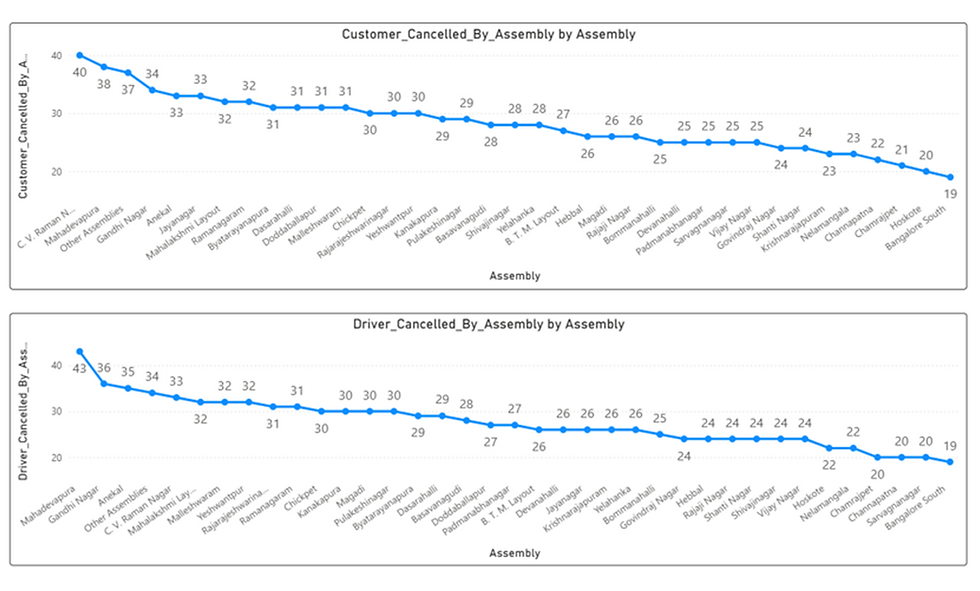
Customer Cancellations – Top & Bottom Zones:
Highest:
C. V. Raman Nagar: 40
Mahadevapura: 38
Other Assemblies: 37
Lowest:
Bangalore South: 19
Hoskote: 20
Chamrajpet: 21
Channapatna: 22
Nelamangala: 23
Driver Cancellations – Top & Bottom Zones:
Highest:
Mahadevapura: 43
Gandhi Nagar: 36
Other Assemblies: 35
C. V. Raman Nagar: 34
Lowest:
Bangalore South: 19
Hoskote & Nelamangala: 22
Chamrajpet, Channapatna, Sarvagnanagar: 20
Recommendations:
Investigate High-Cancellation Zones
Conduct deep dives in Mahadevapura, C. V. Raman Nagar, Gandhi Nagar
Use in-app surveys or post-cancellation prompts to gather insights
Driver Retention Strategies
Offer incentives or priority dispatch in high-cancel zones to reduce drop-offs
Customer Experience Improvements
Add fare transparency, ETA notifications, and chat support in friction-prone areas
Operational Optimization
Improve route mapping, driver density, and surge monitoring in critical zones
Replicate Best Practices
Learn from low-cancellation zones (Bangalore South, Chamrajpet, Hoskote) and apply to underperforming areas
Strategic Recommendations Summary
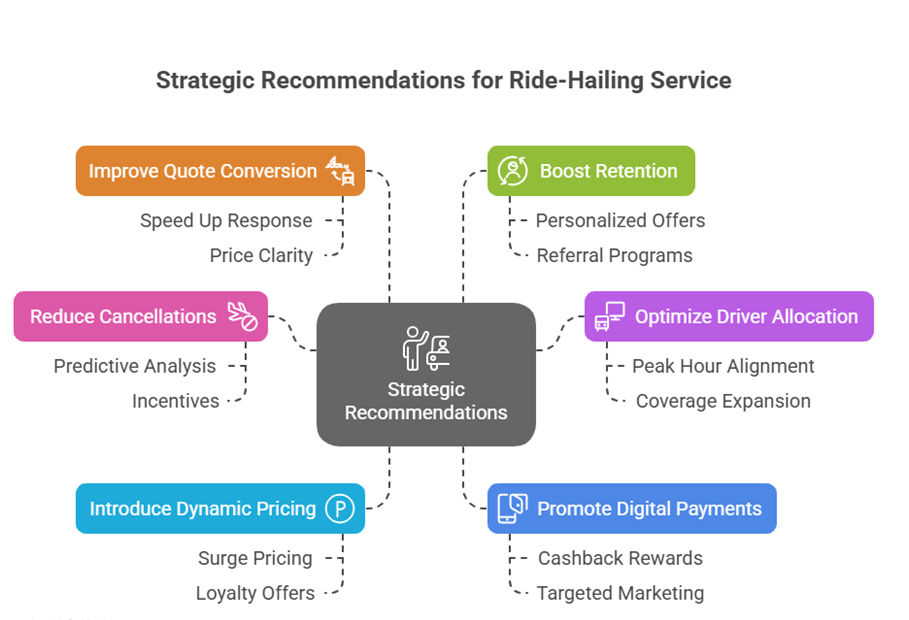
1. Reduce Cancellations with Predictive Action
- Use historical data to identify high-cancellation zones & time windows
- Apply driver incentives & “Confirm Ride Later” features to reduce friction
2. Optimize Driver Allocation
- Align driver shifts with peak hours (0–1 AM, 6–7 AM)
- Expand coverage in high-demand zones like Bangalore South & Ramanagaram
- Pilot ride-pooling or express rides in dense areas
3. Introduce Dynamic Pricing & Loyalty Offers
- Apply surge pricing in peak hours- Offer off
-peak discounts in low-performing zones- Launch loyalty or subscription models to retain frequent riders
4. Promote Digital Payments
- Encourage UPI, Credit/Debit usage with cashback or reward points
- Segment users by payment method for targeted marketing
- Continue supporting cash for flexibility while nudging digital adoption
5. Improve Quote-to-Trip Conversion Funnel
- Speed up quote response and improve price clarity
- Use micro-promotions during low-conversion hours
- Highlight estimated fare/ETA to reduce drop-offs
Today, numerous tools are available for data analysis and generating reports and graphs. Selecting the right tool is crucial, as they offer different capabilities, and the outcome will depend on the tool we choose. The quality and clarity of our visualizations are influenced by the tool we select, making it essential to pick an application that meets our requirements.
Realcode4you endorses Power BI, a predictive and intelligent system capable of converting complex data into visualizations or reports with appealing designs that enhance understanding and readability. As a Power BI partner of Microsoft, Microsoft supports our proficiency in data visualization with Power BI and guarantees that we utilize the best Power BI visuals for our reports and dashboards.
Our Power BI data visualization experts have contributed to the creation of the best Power BI dashboards .


Comments