Sample – Superstore Sales Data Analysis Using Tableau | Tableau Data analysis Help | Realcode4you
- realcode4you
- Jun 28, 2023
- 2 min read
Overview:
Open Tableau 10.1.
From the start page, connect to the Sample – Superstore excel file.
Create a Text view with Region, Sub-Category and Sales.
From the Show Me window, select horizontal bars as a chart type.
Rename the sheet as Subcategory-wise Sales.
Save the workbook as Lesson 3.
Close the workbook
The final view:

Connect to Data Source
1. From the Start menu, open Tableau 10.1.
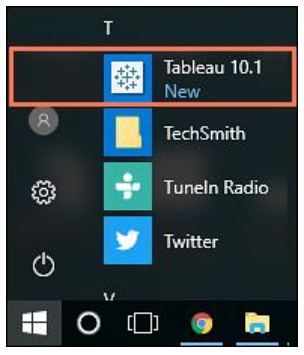
Note: If Tableau icon is not present on the desktop screen, search ‘Tableau’ by entering it in Start menu search bar.
2. On the Start page, under Connect, click Excel.

Now select dataset:

3. On the Data Source page, in the left pane, double-click the Orders table.

All the fields in the Orders table is displayed. The view should resemble the following image:

4. At the bottom, click the Sheet 1 tab.

Create view
5. In the Data pane, under Dimensions, drag and drop the Region dimension to the Rows shelf.
6. Similarly, drag and drop the Sub-Category dimension to the Rows shelf.
The first few rows of the view should resemble the following image:

7. In the Data pane, under Measures, locate and drag Sales to Text, in the Marks card.

This creates the text table.

8. In the right pane, click Show Me, and select Horizontal bars as a chart type

The view should resemble the following image:

Rename sheet
9. At the bottom of the worksheet, right-click Sheet 1, and select Rename Sheet.

10. Rename the sheet as Subcategory-wise Sales
Save workbook
12. From the File menu, select Save.

13. In the Save As window, navigate to Desktop/Tableau Exercises, and save the workbook as Lesson 3. The final view of the visualization should resemble the following image:

14. Close the workbook


Khi tìm hiểu về cách vận hành của Fun79, mình chú ý đến việc thương hiệu nhấn mạnh các yếu tố pháp lý như giấy phép và chứng nhận bảo mật. Dù người dùng phổ thông có thể không xem đây là nội dung nổi bật, nhưng từ góc nhìn phân tích thì đây là một phần quan trọng trong cấu trúc thương hiệu. Nó giúp mình hiểu rõ hơn định hướng phát triển mà nền tảng đang theo đuổi.
"Statistics Assignment Help" is an invaluable resource for students and professionals seeking assistance with their statistical assignments. The service provides expert guidance and support in understanding complex statistical concepts, analyzing data, and completing assignments accurately. With a team of experienced statisticians and educators, it ensures that students receive the help they need to excel in their studies. Whether you're struggling with hypothesis testing, regression analysis, or any other statistical topic, "Statistics Assignment Help" is a reliable and efficient solution to boost your understanding and academic performance.