Machine Learning Clustering Assignment Help | What is Clustering In Machine Learning?
- realcode4you
- Dec 27, 2022
- 4 min read
Clustering
How do I group these documents by topic?
How do I group my customers by purchase patterns?
- Sort items into groups by similarity:
Items in a cluster are more similar to each other than they are to items in other clusters.
Need to detail the properties that characterize “similarity”
- Not a predictive method; finds similarities, relationships
- Our Example: K-means Clustering
What is Cluster Analysis?
Finding groups of objects such that the objects in a group will be similar (or related) to one another and different from (or unrelated to) the objects in other groups.

Types of Clusters: Well-Separated
Well-Separated Clusters:
A cluster is a set of points such that any point in a cluster is closer (or more similar) to every other point in the cluster than to any point not in the cluster.

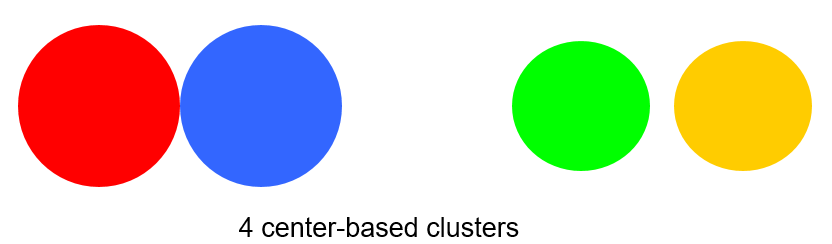
Center-based
A cluster is a set of objects such that an object in a cluster is closer (more similar) to the “center” of a cluster, than to the center of any other cluster
The center of a cluster is often a centroid, the average of all the points in the cluster, or a medoid, the most “representative” point of a cluster
K-Means Clustering - What is it?
- Used for clustering numerical data, usually a set of measurements about objects of interest.
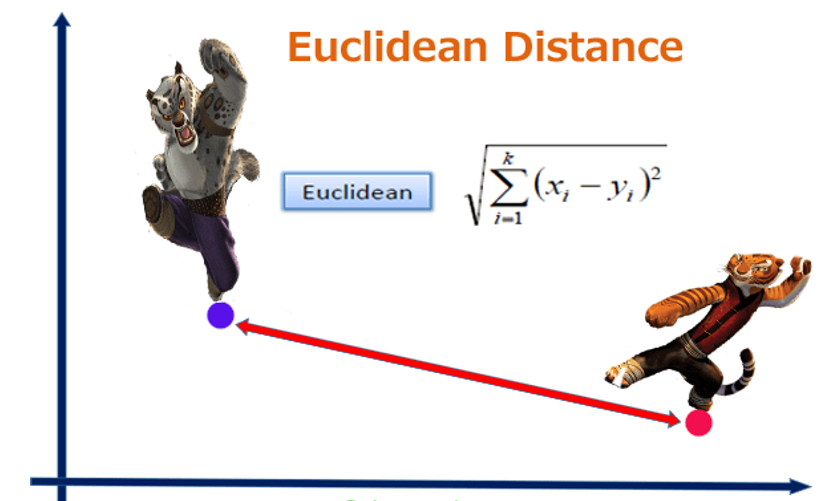
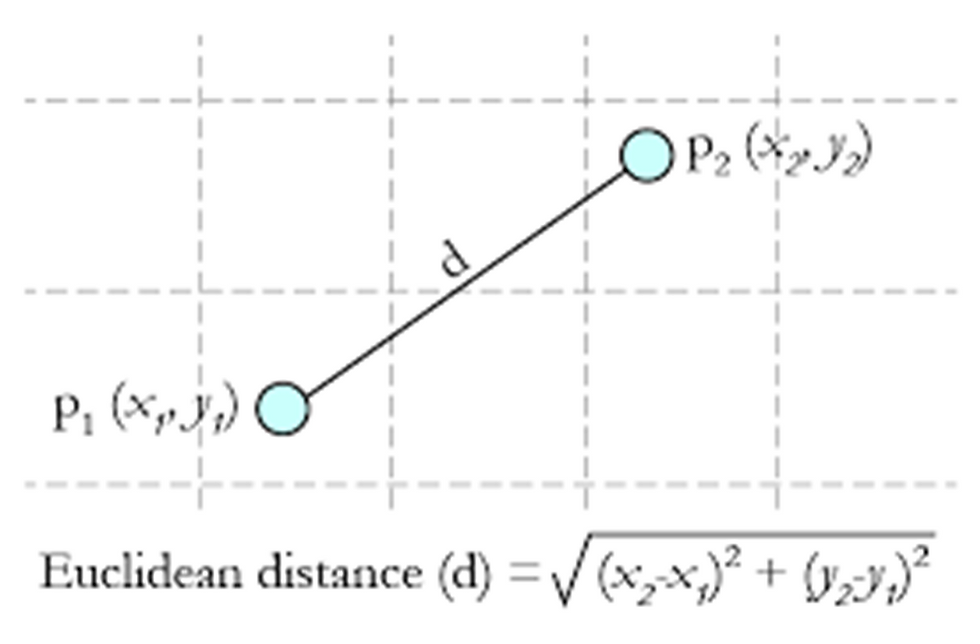
- Input: numerical. There must be a distance metric defined over the variable space.
Euclidian distance
- Output: The centers of each discovered cluster, and the assignment of each input to a cluster.
Centroid
K-means Clustering
Characteristics
Partitional clustering approach
Each cluster is associated with a centroid (center point)
Each point is assigned to the cluster with the closest centroid
Number of clusters, K, must be specified
The basic algorithm is very simple
Algorithm:

K-means Clustering – Details
- Initial centroids are often chosen randomly.
Clusters produced vary from one run to another.
- The centroid is (typically) the mean of the points in the cluster.
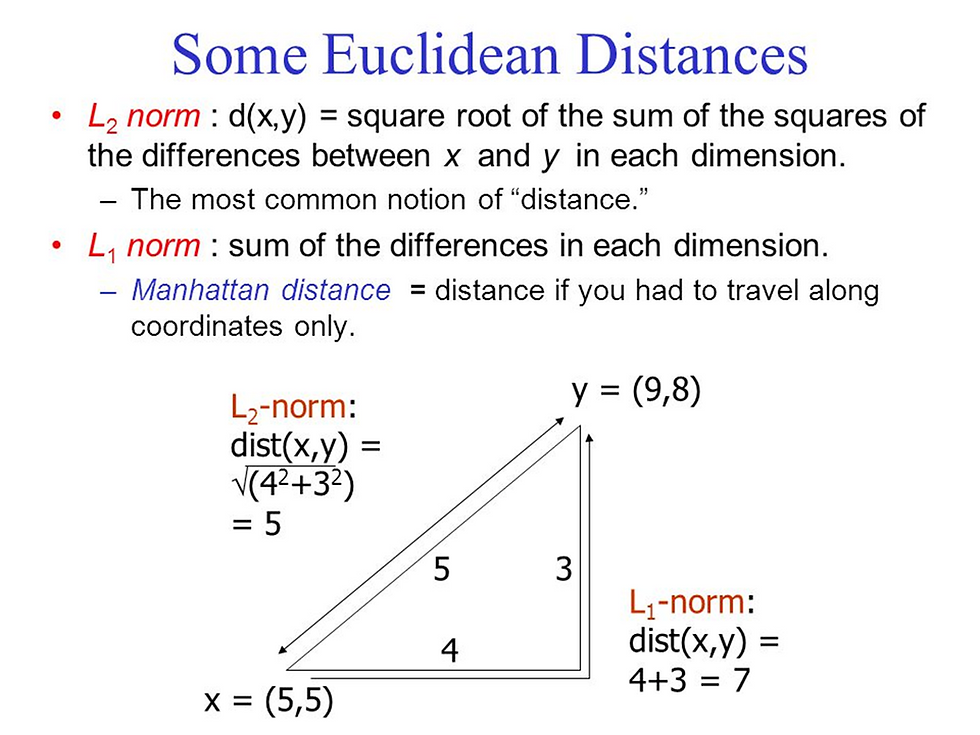
- ‘Closeness’ is measured by Euclidean distance, cosine similarity, correlation, etc.
- K-means will converge for common similarity measures mentioned above.
- Most of the convergence happens in the first few iterations.
Often the stopping condition is changed to ‘Until relatively few points change clusters’
- Complexity is O( n * K * I * d )
n = number of points, K = number of clusters, I = number of iterations, d = number of attributes
Use Cases
- Often an exploratory technique:
Discover structure in the data
Summarize the properties of each cluster
- Sometimes a pre-step to classification:
"Discovering the classes“
- Examples
The height, weight and average lifespan of animals
Household income, yearly purchase amount in dollars, number of household members of customer households
Patient record with measures of BMI, HBA1C, HDL
Diagnostics – Evaluating the Model
- Do the clusters look separated in at least some of the plots when you do pair-wise plots of the clusters?
Pair-wise plots can be used when there are not many variables
- Do you have any clusters with few data points?
Try decreasing the value of K
- Are there splits on variables that you would expect, but don't see?
Try increasing the value K
- Do any of the centroids seem too close to each other?
Try decreasing the value of K
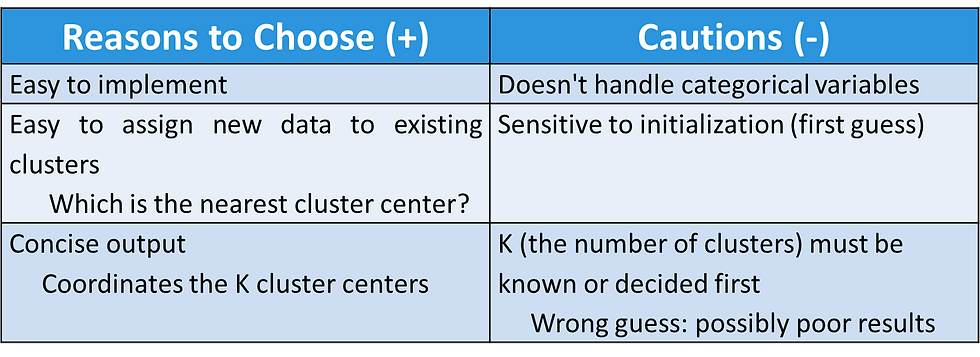
K-Means Clustering - Reasons to Choose (+) and Cautions (-)
K-Means case study
- This section shows k-means clustering of iris data.
- First, we remove species from the data to cluster. After that, we apply function kmeans() to iris2, and store the clustering result in kmeans.result.
The cluster number is set to 3 in the code below.
iris2 <- iris
 iris2
 iris2$Species <- NULL
 iris2
 kmeans.result <- kmeans(iris2, 3)
Comparison with real class
- The clustering result is then compared with the class label (Species) to check whether similar objects are grouped together.
table(iris$Species, kmeans.result$cluster)
The above result shows that cluster \setosa" can be easily separated from the other clusters, and
that clusters \versicolor" and \virginica" are to a small degree overlapped with each other.
Plotting the results
- Next, the clusters and their centers are plotted
- Note that there are four dimensions in the data and that only the first two dimensions are used to draw the plot below.
- Some black points close to the green center (asterisk) are actually closer to the black center in the four dimensional space.
- We also need to be aware that the results of k-means clustering may vary from run to run, due to random selection of initial cluster centers.
plot(iris2[c("Sepal.Length", "Sepal.Width")], col = kmeans.result$cluster)- # plot cluster centers
points(kmeans.result$centers[,c("Sepal.Length", "Sepal.Width")], col = 1:3, pch = 8, cex=2)points(kmeans.result$centers[,c("Sepal.Length", "Sepal.Width")], col = 1:3, pch = 8, cex=2)Pch, cex for shapes
pch=0,square pch=1,circle pch=2,triangle point up pch=3,plus pch=4,cross pch=5,diamond pch=6,triangle point down pch=7,square cross pch=8,star pch=9,diamond plus pch=10,circle plus pch=11,triangles up and down pch=12,square plus pch=13,circle
cex controls the symbol size in the plot,
default is cex=1, col controls the color of the symbol border,
default is col="black".
Show result in 3 dim
library(ggplot2)
ggplot(iris, aes(Petal.Length, Petal.Width, color = Species)) + geom_point()
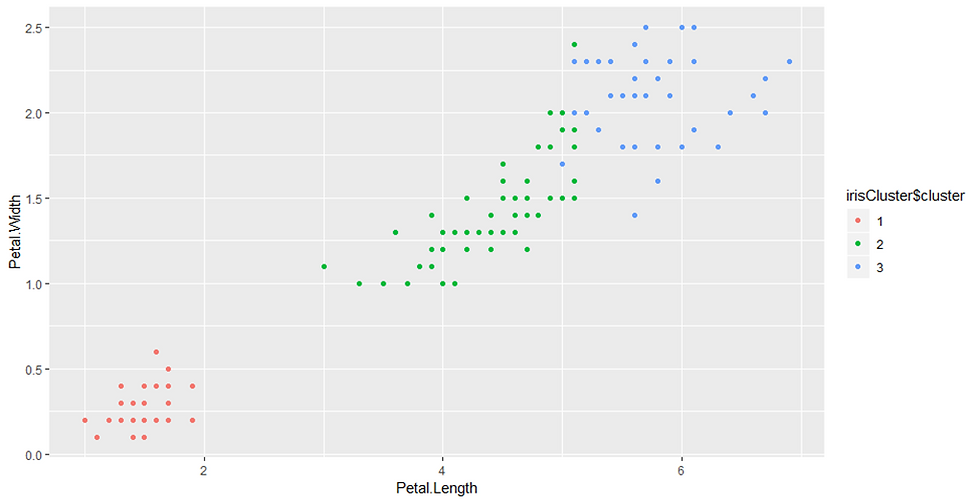
irisCluster <- kmeans(iris[, 1:4], 3)
irisCluster
table(iris$Species, irisCluster$cluster)
irisCluster$cluster <- as.factor(irisCluster$cluster)
ggplot(iris, aes(Petal.Length, Petal.Width, color = irisCluster$cluster)) + geom_point()Output:
geom_point()
The point geom is used to create scatterplots. The scatterplot is most useful for displaying the relationship between two continuous variables. It can be used to compare one continuous and one categorical variable, or two categorical variables
To get any help in Machine learning Clustering you can contact us. Here you get quality code without any plagiarism issues.
Send your project or assignment requirement details at:
realcode4you@gmail.com


Comments