Instagram Post Analysis Practice Set Questions And Answers
- realcode4you
- Aug 13, 2021
- 4 min read
Requirements
Domain: Social Media
Project: Analysis of Instagram posts
The dataset, sourced from Kaggle, is a compilation of details about Instagram posts, for posts posted between 04/05/2012, 2:36 PM (UTC) and 04/27/2020, 3:34 PM (UTC), by a set of over 1.04 billion Instagram users. The project aims to glean insights about factors that impact engagement of posts on Instagram. The dataset captures details such as number of comments received for a post, number of likes received for a post, timestamp for each post, number of followers each user has, number of Instagram handles each user follows, gender of each Instagram user, number of total posts each user has posted, and more.
The project aims to understand the dataset and explore the following:
1. Which Instagram ID has the highest number of followers?
2. Which Instagram ID has received the highest number of comments?
3. Which Instagram ID has the highest number of likes overall?
4. Which Instagram ID has posted the greatest number of posts?
5. Relationship between gender and number of followers. Do males have a greater number of followers on an average?
6. Do males get a greater number of likes for their posts on an average?
7. Do females get a greater number of comments on an average? That is, are females better at conversations in Instagram interactions?
8. Which topic category is the most popular?
9. Do Instagrammers with a greater number of posts also have more followers?
10. Which format do Instagrammers “like” the most? GraphImage, GraphSidecar or GraphVideo?
11. Is there an hour of the day when Instagram posts receive high engagement?
12. Is there an hour of the day when Instagram posts receive high engagement?
Analysis of the Instagram dataset can help a brand looking to build Instagram presence identify the best time of the day to post on Instagram, the format that is a hit in Instagram posts, the type of posts that could help increase engagement, and more. Apart from this, the analysis would also help establish a correlation between gender and Instagram presence
Solution
First Need to import all related Libraries
#import Libraries
import pandas as pd
import numpy as np
import matplotlib.pyplot as plt
%matplotlib inline
import seaborn as sns
sns.set_palette("dark")
# importing the first 20,000 rows into a pandas dataframe due to large file
ig_df=pd.read_csv('ig_all.csv',nrows=20000)
ig_df.head()Output

ig_df.info()Output:
<class 'pandas.core.frame.DataFrame'>
RangeIndex: 20000 entries, 0 to 19999
Data columns (total 15 columns):
 #   Column              Non-Null Count  Dtype
---  ------              --------------  -----
 0   _id                 20000 non-null  int64
 1   content             19650 non-null  object
 2   display_url         20000 non-null  object
 3   num_comment         20000 non-null  float64
 4   num_like            20000 non-null  float64
 5   post_type           20000 non-null  object
 6   shortcode           20000 non-null  object
 7   taken_at_timestamp  20000 non-null  float64
 8   topic               12948 non-null  object
 9   user_id             20000 non-null  float64
 10  video_view_count    2283 non-null   float64
 11  num_follower        20000 non-null  float64
 12  num_following       20000 non-null  float64
 13  num_post            20000 non-null  float64
 14  gender              20000 non-null  object
dtypes: float64(8), int64(1), object(6)
memory usage: 2.3+ MB
# filling missing numerical values with zeroes
ig_df['video_view_count']= ig_df['video_view_count'].fillna(0)
ig_df.info()Output:
<class 'pandas.core.frame.DataFrame'>
RangeIndex: 20000 entries, 0 to 19999
Data columns (total 15 columns):
 #   Column              Non-Null Count  Dtype
---  ------              --------------  -----
 0   _id                 20000 non-null  int64
 1   content             19650 non-null  object
 2   display_url         20000 non-null  object
 3   num_comment         20000 non-null  float64
 4   num_like            20000 non-null  float64
 5   post_type           20000 non-null  object
 6   shortcode           20000 non-null  object
 7   taken_at_timestamp  20000 non-null  float64
 8   topic               12948 non-null  object
 9   user_id             20000 non-null  float64
 10  video_view_count    20000 non-null  float64
 11  num_follower        20000 non-null  float64
 12  num_following       20000 non-null  float64
 13  num_post            20000 non-null  float64
 14  gender              20000 non-null  object
dtypes: float64(8), int64(1), object(6)
memory usage: 2.3+ MBig_df.head()Output:

Question 1 Solution
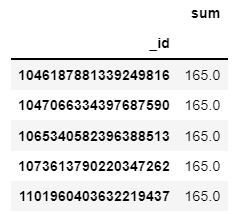
# grouping the dataframe by _id and then summing over the num_follower for each id.
max_follower=ig_df.groupby('_id')['num_follower'].agg(['sum'])
max_follower.head()
Output:

# ids with maximum followers
id_max_follower=max_follower[max_follower['sum']==max_follower['sum'].max()].index.values
print('max number of followers=',max_follower['sum'].max(),'\n')
print('Ids with the max followers is',id_max_follower)
Output:
max number of followers= 26280948.0

Ids with the max followers is [2053657551225881312 2053811981908728430 2054544082723514844
 2055157062351844210 2055509581288695214 2055793451858807002
 2057960418644557485 2059109082154734461 2059995089230153281
 2060134066545331768 2060704945805256020 2060710363134736834
 2274745455451446849 2276719918892009433 2282843945801026492
 2283190016439933203 2287037339771303750 2287756184320231336
 2289293448963859570 2290479338171950095 2292144044351738133
 2293453619617278217 2294276992521979098 2295542011855270358]
Question 2 Solution
# grouping the dataframe by _id and then summing over the num_comment for each id.
max_comments=ig_df.groupby('_id')['num_comment'].agg(['sum'])
max_comments.head()
Output:

# ids with maximum comments
id_max_comment=max_comments[max_comments['sum']==max_comments['sum'].max()].index.values
print('max number of comments=',max_comments['sum'].max(),'\n')
print('Ids with the max comments is',id_max_comment)
Output:
max number of comments= 96623.0

Ids with the max comments is [2199148278017001460]
Question 3 Solution
# grouping the dataframe by _id and then summing over the num_likes for each id.
max_likes=ig_df.groupby('_id')['num_like'].agg(['sum'])
max_likes.head()
Output:

# ids with maximum likes
id_max_like=max_likes[max_likes['sum']==max_likes['sum'].max()].index.values
print('max number of likes=',max_likes['sum'].max(),'\n')
print('Ids with the max likes is',id_max_like)
Output:
max number of likes= 335208.0

Ids with the max likes is [2283190016439933203]
Question 4 Solution
# grouping the dataframe by _id and then summing over the num_likes for each id.
max_posts=ig_df.groupby('_id')['num_post'].agg(['sum'])
max_posts.head()
Output:
# ids with maximum posts
id_max_post=max_posts[max_posts['sum']==max_posts['sum'].max()].index.values
print('max number of posts=',max_posts['sum'].max(),'\n')
print('Ids with the max posts is',id_max_post)
Output:
max number of posts= 17816.0

Ids with the max posts is [2023489855060727450 2023671756153268292 2024270956981181438
 2024311403116147980 2024850437651330901 2024865985592337534
 2025870536474678106 2025911065145175037 2025963768353305945
 2026994137861035377 2027066606592533756 2027521861734282390
 2027983787740160545 2028002072733126618 2028192584597270997
 2028519915136361379 2028990819444205941 2029061363728407151
 2029207970096707065 2029479002128848974 2029609024504333563
 2030327958853607288 2031020603489694743 2031154650962703718
 2031405266297202794 2031717130558319719 2031835376628352077
 2031842729285311621 2032447283370419721 2032717147154732449
 2033202974343538364 2033317668777611929 2033479262585097801
 2033809791750749527 2033986828155105764 2034027119310306594
 2034053221546306089 2034600096888366149 2034665040803724121
 2034670475312915993 2035422352908737783 2036077423501690128
 2036405851689900953 2036813955573230113 2036878208997054542
 2036900320168254012 2036955508535064590 2037646181873735056
 ...
 ...
Question 5 Solution
ig_df.groupby('gender')['num_follower'].agg(['mean']).plot.bar(figsize=(13,6))
plt.show()
Output:

If you need any help in Data Analysis, Data Visualization which is related to machine learning then you can contact Us:
Send your request at realcode4you@gmail.com and get instant help with an affordable price.
We are always focus to delivered unique or without plagiarism code which is written by our highly educated professional which provide well structured code within your given time frame.
If you are looking other programming language help like C, C++, Java, Python, PHP, Asp.Net, NodeJs, ReactJs, etc. with the different types of databases like MySQL, MongoDB, SQL Server, Oracle, etc. then also contact us.


Comments