Implementing KNN(K Nearest Neighbor) Using Python Machine Learning
- realcode4you
- Jan 10, 2022
- 5 min read
Import necessary packages:
%matplotlib inline
import warnings
warnings.filterwarnings("ignore")
import pandas as pd
import numpy as np
import nltk
import matplotlib.pyplot as plt
import seaborn as sns
from sklearn.feature_extraction.text import TfidfVectorizer
from sklearn.feature_extraction.text import CountVectorizer
from sklearn.metrics import confusion_matrix
from sklearn import metrics
from sklearn.metrics import roc_curve, auc
import re
# Tutorial about Python regular expressions: https://pymotw.com/2/re/
import pickle
from tqdm import tqdm
import os
from plotly import plotly
import plotly.offline as offline
import plotly.graph_objs as go
offline.init_notebook_mode()
from collections import Counter
Loading Data
#Load Data and take 5000 data point from dataset
data  = pd.read_csv('preprocessed_data.csv', nrows=5000)
# data  = pd.read_csv('preprocessed_data.csv', nrows=50000) # you can take less number of rows like this
data.head(5)
Output:

Choose Features and Target Variables
y = data['project_is_approved'].values
X = data.drop(['project_is_approved'], axis=1)
X.head(1)
Output:

Splitting data into Train and cross validation(or test): Stratified Sampling
# train test split
from sklearn.model_selection import train_test_split
X_train, X_test, y_train, y_test = train_test_split(X, y, test_size=0.33, stratify=y)
X_train, X_cv, y_train, y_cv = train_test_split(X_train, y_train, test_size=0.33, stratify=y_train)
Make Data Model Ready: encoding numerical, categorical features
Encoding categorical features: School State
vectorizer = CountVectorizer()
vectorizer.fit(X_train['school_state'].values) # fit has to happen only on train data

# we use the fitted CountVectorizer to convert the text to vector
X_train_state_ohe = vectorizer.transform(X_train['school_state'].values)
X_cv_state_ohe = vectorizer.transform(X_cv['school_state'].values)
X_test_state_ohe = vectorizer.transform(X_test['school_state'].values)

print("After vectorizations")
print(X_train_state_ohe.shape, y_train.shape)
print(X_cv_state_ohe.shape, y_cv.shape)
print(X_test_state_ohe.shape, y_test.shape)
print(vectorizer.get_feature_names())
print("="*100)
Output:
[[1 0 1 0 0 0 0 0 0 1 1 1 0] [0 1 0 1 0 1 1 1 1 0 1 0 0] [0 0 0 0 1 0 0 1 1 0 1 0 1]] ['break', 'breakfast', 'classroom', 'free', 'grades', 'homes', 'income', 'low', 'receive', 'should', 'students', 'take', 'will']
Encoding categorical features: essay
print(X_train.shape, y_train.shape)
print(X_cv.shape, y_cv.shape)
print(X_test.shape, y_test.shape)

print("="*100)


vectorizer = CountVectorizer(min_df=10,ngram_range=(1,4), max_features=5000)
vectorizer.fit(X_train['essay'].values) # fit has to happen only on train data

# we use the fitted CountVectorizer to convert the text to vector
X_train_essay_bow = vectorizer.transform(X_train['essay'].values)
X_cv_essay_bow = vectorizer.transform(X_cv['essay'].values)
X_test_essay_bow = vectorizer.transform(X_test['essay'].values)

print("After vectorizations")
print(X_train_essay_bow.shape, y_train.shape)
print(X_cv_essay_bow.shape, y_cv.shape)
print(X_test_essay_bow.shape, y_test.shape)
print("="*100)


# print("YOU SHOULD NOT DO SOMETHING LIKE THIS")
# vectorizer = CountVectorizer()
# x_train_bow = vectorizer.fit_transform(X_train['essay'].values)
# x_cv_bow = vectorizer.fit_transform(X_cv['essay'].values)
# x_test_bow = vectorizer.fit_transform(X_test['essay'].values)

# print(x_train_bow.shape, y_train.shape)
# print(x_cv_bow.shape, y_cv.shape)
# print(x_test_bow.shape, y_test.shape)

print("NOTE: THE NUMBER OF COLUMNS IN EACH OF THE VECTOR WONT BE SAME")
Output:
(2244, 8) (2244,) (1106, 8) (1106,) (1650, 8) (1650,) ==================================================================================================== After vectorizations (2244, 5000) (2244,) (1106, 5000) (1106,) (1650, 5000) (1650,) ==================================================================================================== NOTE: THE NUMBER OF COLUMNS IN EACH OF THE VECTOR WONT BE SAME
Encoding categorical features: teacher_prefix
vectorizer = CountVectorizer()
vectorizer.fit(X_train['teacher_prefix'].values) # fit has to happen only on train data

# we use the fitted CountVectorizer to convert the text to vector
X_train_teacher_ohe = vectorizer.transform(X_train['teacher_prefix'].values)
X_cv_teacher_ohe = vectorizer.transform(X_cv['teacher_prefix'].values)
X_test_teacher_ohe = vectorizer.transform(X_test['teacher_prefix'].values)

print("After vectorizations")
print(X_train_teacher_ohe.shape, y_train.shape)
print(X_cv_teacher_ohe.shape, y_cv.shape)
print(X_test_teacher_ohe.shape, y_test.shape)
print(vectorizer.get_feature_names())
print("="*100)
Output:
After vectorizations (2244, 4) (2244,) (1106, 4) (1106,) (1650, 4) (1650,) ['mr', 'mrs', 'ms', 'teacher'] ====================================================================================================
Encoding categorical features: project_grade_category
vectorizer = CountVectorizer()
vectorizer.fit(X_train['project_grade_category'].values) # fit has to happen only on train data

# we use the fitted CountVectorizer to convert the text to vector
X_train_grade_ohe = vectorizer.transform(X_train['project_grade_category'].values)
X_cv_grade_ohe = vectorizer.transform(X_cv['project_grade_category'].values)
X_test_grade_ohe = vectorizer.transform(X_test['project_grade_category'].values)

print("After vectorizations")
print(X_train_grade_ohe.shape, y_train.shape)
print(X_cv_grade_ohe.shape, y_cv.shape)
print(X_test_grade_ohe.shape, y_test.shape)
print(vectorizer.get_feature_names())
print("="*100)
Output:
After vectorizations (2244, 4) (2244,) (1106, 4) (1106,) (1650, 4) (1650,) ['grades_3_5', 'grades_6_8', 'grades_9_12', 'grades_prek_2'] ====================================================================================================
Encoding numerical features: Price
from sklearn.preprocessing import Normalizer
normalizer = Normalizer()
# normalizer.fit(X_train['price'].values)
# this will rise an error Expected 2D array, got 1D array instead:
# array=[105.22 215.96  96.01 ... 368.98  80.53 709.67].
# Reshape your data either using
# array.reshape(-1, 1) if your data has a single feature
# array.reshape(1, -1)  if it contains a single sample.
normalizer.fit(X_train['price'].values.reshape(1,1))

X_train_price_norm = normalizer.transform(X_train['price'].values.reshape(1,-1))
X_cv_price_norm = normalizer.transform(X_cv['price'].values.reshape(1,-1))
X_test_price_norm = normalizer.transform(X_test['price'].values.reshape(1,-1))

print("After vectorizations")
print(X_train_price_norm.shape, y_train.shape)
print(X_cv_price_norm.shape, y_cv.shape)
print(X_test_price_norm.shape, y_test.shape)
print("="*100)
Output:
After vectorizations (2244, 1) (2244,) (1106, 1) (1106,) (1650, 1) (1650,) ====================================================================================================
Simarly you can convert remaining features into vectors
Concatinating all the features
# merge two sparse matrices: https://stackoverflow.com/a/19710648/4084039
from scipy.sparse import hstack
X_tr = hstack((X_train_essay_bow, X_train_state_ohe, X_train_teacher_ohe, X_train_grade_ohe, X_train_price_norm)).tocsr()
X_cr = hstack((X_cv_essay_bow, X_cv_state_ohe, X_cv_teacher_ohe, X_cv_grade_ohe, X_cv_price_norm)).tocsr()
X_te = hstack((X_test_essay_bow, X_test_state_ohe, X_test_teacher_ohe, X_test_grade_ohe, X_test_price_norm)).tocsr()

print("Final Data matrix")
print(X_tr.shape, y_train.shape)
print(X_cr.shape, y_cv.shape)
print(X_te.shape, y_test.shape)
print("="*100)
Output:
Final Data matrix (2244, 5060) (2244,) (1106, 5060) (1106,) (1650, 5060) (1650,) ====================================================================================================
Appling KNN on different kind of featurization as mentioned in the instructions:
Appling KNN: BOW featurization
Hyper parameter Tuning (YOU CAN FOLLOW ANY ONE OF THESE)
Method 1: Simple for loop (if you are having memory limitations use this)
def batch_predict(clf, data):
    # roc_auc_score(y_true, y_score) the 2nd parameter should be probability estimates of the positive class
    # not the predicted outputs

    y_data_pred = []
    tr_loop = data.shape[0] - data.shape[0]%1000
    # consider you X_tr shape is 49041, then your tr_loop will be 49041 - 49041%1000 = 49000
    # in this for loop we will iterate unti the last 1000 multiplier
    for i in range(0, tr_loop, 1000):
        y_data_pred.extend(clf.predict_proba(data[i:i+1000])[:,1])
    # we will be predicting for the last data points
    if data.shape[0]%1000 !=0:
        y_data_pred.extend(clf.predict_proba(data[tr_loop:])[:,1])

    return y_data_pred
import matplotlib.pyplot as plt
from sklearn.neighbors import KNeighborsClassifier
from sklearn.metrics import roc_auc_score
"""
y_true : array, shape = [n_samples] or [n_samples, n_classes]
True binary labels or binary label indicators.
y_score : array, shape = [n_samples] or [n_samples, n_classes]
Target scores, can either be probability estimates of the positive class, confidence values, or non-thresholded measure of
decisions (as returned by “decision_function” on some classifiers).
For binary y_true, y_score is supposed to be the score of the class with greater label.
"""
train_auc = []
cv_auc = []
K = [3, 15, 25, 51, 101]
for i in tqdm(K):
neigh = KNeighborsClassifier(n_neighbors=i, n_jobs=-1)
neigh.fit(X_tr, y_train)
y_train_pred = batch_predict(neigh, X_tr)
y_cv_pred = batch_predict(neigh, X_cr)
# roc_auc_score(y_true, y_score) the 2nd parameter should be probability estimates of the positive class
# not the predicted outputs
train_auc.append(roc_auc_score(y_train,y_train_pred))
cv_auc.append(roc_auc_score(y_cv, y_cv_pred))
plt.plot(K, train_auc, label='Train AUC')
plt.plot(K, cv_auc, label='CV AUC')
plt.scatter(K, train_auc, label='Train AUC points')
plt.scatter(K, cv_auc, label='CV AUC points')
plt.legend()
plt.xlabel("K: hyperparameter")
plt.ylabel("AUC")
plt.title("ERROR PLOTS")
plt.grid()
plt.show()100%|████████████████████████████████████████████████████████████████████████████████████| 5/5 [00:05<00:00, 1.02s/it]

Method 1: Simple for loop (if you are having memory limitations use this)
# https://scikit-learn.org/stable/modules/generated/sklearn.model_selection.GridSearchCV.html
from sklearn.model_selection import GridSearchCV
from scipy.stats import randint as sp_randint
from sklearn.model_selection import RandomizedSearchCV

neigh = KNeighborsClassifier(n_jobs=-1)
parameters = {'n_neighbors':sp_randint(50, 100)}
clf = RandomizedSearchCV(neigh, parameters, cv=3, scoring='roc_auc')
clf.fit(X_tr, y_train)

results = pd.DataFrame.from_dict(clf.cv_results_)
results = results.sort_values(['param_n_neighbors'])

train_auc= results['mean_train_score']
train_auc_std= results['std_train_score']
cv_auc = results['mean_test_score']
cv_auc_std= results['std_test_score']
K =  results['param_n_neighbors']

plt.plot(K, train_auc, label='Train AUC')
# this code is copied from here: https://stackoverflow.com/a/48803361/4084039
# plt.gca().fill_between(K, train_auc - train_auc_std,train_auc + train_auc_std,alpha=0.2,color='darkblue')

plt.plot(K, cv_auc, label='CV AUC')
# this code is copied from here: https://stackoverflow.com/a/48803361/4084039
# plt.gca().fill_between(K, cv_auc - cv_auc_std,cv_auc + cv_auc_std,alpha=0.2,color='darkorange')

plt.scatter(K, train_auc, label='Train AUC points')
plt.scatter(K, cv_auc, label='CV AUC points')

plt.legend()
plt.xlabel("K: hyperparameter")
plt.ylabel("AUC")
plt.title("Hyper parameter Vs AUC plot")
plt.grid()
plt.show()

results.head()
Output:

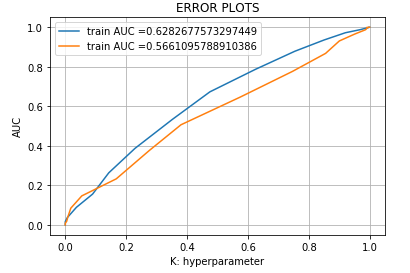
Testing the performance of the model on test data, plotting ROC Curves
# from the error plot we choose K such that, we will have maximum AUC on cv data and gap between the train and cv is less
# Note: based on the method you use you might get different hyperparameter values as best one
# so, you choose according to the method you choose, you use gridsearch if you are having more computing power and note it will take more time
# if you increase the cv values in the GridSearchCV you will get more rebust results.

#here we are choosing the best_k based on forloop results
best_k = 95
# https://scikit-learn.org/stable/modules/generated/sklearn.metrics.roc_curve.html#sklearn.metrics.roc_curve
from sklearn.metrics import roc_curve, auc

neigh = KNeighborsClassifier(n_neighbors=best_k, n_jobs=-1)
neigh.fit(X_tr, y_train)
# roc_auc_score(y_true, y_score) the 2nd parameter should be probability estimates of the positive class
# not the predicted outputs

y_train_pred = batch_predict(neigh, X_tr)
y_test_pred = batch_predict(neigh, X_te)

train_fpr, train_tpr, tr_thresholds = roc_curve(y_train, y_train_pred)
test_fpr, test_tpr, te_thresholds = roc_curve(y_test, y_test_pred)

plt.plot(train_fpr, train_tpr, label="train AUC ="+str(auc(train_fpr, train_tpr)))
plt.plot(test_fpr, test_tpr, label="train AUC ="+str(auc(test_fpr, test_tpr)))
plt.legend()
plt.xlabel("K: hyperparameter")
plt.ylabel("AUC")
plt.title("ERROR PLOTS")
plt.grid()
plt.show()
Output:
# we are writing our own function for predict, with defined thresould
# we will pick a threshold that will give the least fpr
def find_best_threshold(threshould, fpr, tpr):
    t = threshould[np.argmax(tpr*(1-fpr))]
    # (tpr*(1-fpr)) will be maximum if your fpr is very low and tpr is very high
    print("the maximum value of tpr*(1-fpr)", max(tpr*(1-fpr)), "for threshold", np.round(t,3))
    return t

def predict_with_best_t(proba, threshould):
    predictions = []
    for i in proba:
        if i>=threshould:
            predictions.append(1)
        else:
            predictions.append(0)
    return predictions
print("="*100)
from sklearn.metrics import confusion_matrix
best_t = find_best_threshold(tr_thresholds, train_fpr, train_tpr)
print("Train confusion matrix")
print(confusion_matrix(y_train, predict_with_best_t(y_train_pred, best_t)))
print("Test confusion matrix")
print(confusion_matrix(y_test, predict_with_best_t(y_test_pred, best_t)))Output:
==================================================================================================== the maximum value of tpr*(1-fpr) 0.35336663001865454 for threshold 0.821 Train confusion matrix [[ 158 143] [ 635 1308]] Test confusion matrix [[ 94 127] [505 924]]


Comments