Semi-real-life data analysis(Airlines staff activities - modified.csv) using RapidMiner CRISP-DM Phases | Realcode4you
- realcode4you
- May 17
- 7 min read
Introduction
This assignment is designed for you to practice several activities in the six phases of CRISP-DM using a semi-real-life data set. The data set Airlines staff activities - modified.csv that we are going to use in this assignment is an HR example. Throughout the semester, you will see many examples spanning across many business disciplines.
Scenario
ACME airlines has collected data about their employees on the following three job functions:
customer service personnel, mechanics and dispatchers. The company wishes to know if these job functions appeal to certain personality traits. They specifically looked at employees’ interests in outdoor activities, sociability and conservativeness. You are asked to build a model using most variables in the dataset to predict job functions. If this is successfully completed, the company will be able to evaluate new hires based on their psychological traits in addition to technical skills.
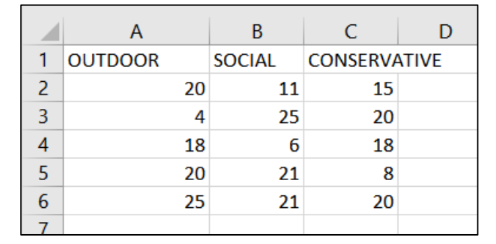
The dataset includes the following variables:
OUTDOOR: employee’s interest in outdoor activities. Valid values are 0 – 35.
SOCIAL: employee’s interest in social activities. Valid values are 0 – 35.
CONSERVATIVE: interest in conservativeness. Valid values are 0 – 35
JOB_FUNCTION: job function.
JID: job ID.
In this assignment, you will also be asked to create screenshots of your Rapidminer Process View and the result. If you are not familiar with how to capture screenshots, please Google to train yourself. There are plenty of tutorials that show you how it is done in your favorite operation system. If you are using Windows, the Snipping Tool may be used to capture screenshots.
Your will document your analysis with screenshots in Assignment 1.docx and submit it along with the exported process file. Please carefully follow the steps below.
Rapidminer operators used
You will use the following operators in this assignment: RETRIEVE, REPLACE, FILTER EXAMPLES, SELECT ATTRIBUTES, SET ROLE, SPLIT DATA, NORMALIZE, DECISION TREE, K-NN, APPLY MODEL, and PERFORMANCE.
Section 1: Decision Tree
Note: I would like to keep the amount of your work reasonable. Therefore, we will not be engaged in all activities in each of the CRISP-DM phases, but we will cover some essential ones.
Note: Please clearly show the CRISP-DM phases as your section headings in the Word file.
Phase 1: Business understanding
We will assume the activities of this step have been completed for you, since I provided you the data set and defined the business problem (i.e., to model job functions).
In your Word document, please briefly describe what we are trying to do in this assignment.
Phase 2: Data understanding
Data are already provided to you, but you need to describe the data and verify data quality. We will focus on just the data quality here for this assignment.
Import the dataset into Rapidminer. While importing, you may encounter issues for the
CONSERVATIVE variable. Leave it as a polynominal variable. We will fix the issue later in the assignment.
Drag the dataset to the Process View in Rapidminer and look at both the Data and Statistics tabs in the result.
Write a paragraph or two with a screenshot of the Statistics tab in the result to report what you see in the following issues. Circle the following issues in your Statistics screenshot.
1. Missing values. Report the number of missing values.
2. Strange values. Go through each column and identify those values that are
apparently wrong for the column. Explain why you think they are strange. Let’s
focus on the following two types of strange values:
a. Value out of range: a value that does not seem to be in the correct range. Examples
are Age > 150, Salary < -300, and NumOfDependents > 200.
b. Invalid format: Salary = None while all values in Salary are numeric.
Age = Fifteen
while all other values in the Age column are numbers.
3. Strange data types. Review the slides for data types. Take a close look at data type of each column. Identify strange data types and explain why they are strange.
Phase 3: Data preparation
Do the following to clean the data:
Perform listwise removal of records with missing values (Hint: Use Filter Example Operator).
Remove rows with values out of range (Hint: Use Filter Example Operator).
As for values with an invalid format, it all depends on whether the values can be fixed. In this assignment these values can actually be fixed. See the next bullet point.
4. CONSERVATIVE is a bit tricky. It has two text values. Because of these text values, Rapidminer
treats it as a nominal column. You will do the following in your Rapidminer design to fix it.
a. Replace each text value individually with the correct numeric value. (Hint: you may need
to use the REPLACE operator twice, one for each.)
b. Convert this column into numeric using the Parse Numbers operator. (This step requires
a little bit of research to finish. It is really simple.)
5. Show a screenshot of the resulting data. Discuss if the issues in phase 2 have been resolved.
(Hint: there are 241 records left at this point.)
If you cannot see the attributes on the dropdown list in any of the steps, you should toggle on
the "Synchronize Meta Data with Real Data" option in Process pull down menu. Run the process once and it back fills the Meta data and you can then see your attribute names populate. You can also type the attribute name instead of selecting the name from the dropdown menu.
Phase 4: Modeling
1. Select CONSERVATIVE, JOB_FUNCTION, OUTDOOR and SOCIAL for your model.
2. Set JOB_FUNCTION to be your response variable. You will split the data into 80/20 in Rapidminer.
Use the Set Role and Split Data(automatic) operators for these. See class discussion.
a. Pay specially attention to this. Make sure the 80% of the data is used as the
training set and 20% as the test set.
b. Both the training and test datasets must be used in your design.
3. Use the training dataset to build your Decision Tree model.
4. Use Gini index as the purity function. Perform both pre-pruning and post-pruning
using the default setting (Only change the minimal gain to 0.1).
5. Q1: Report your findings and back your findings with screenshots of the above result.
6. Q2: Is the accuracy of your model acceptable? (Let’s consider Accuracy >= 70% to
be acceptable for this assignment. 70% is no magic number. The ideal cutoff in real life
depends on the context and the application. More on this in class.) Show screenshot of
confusion matrix. Describe the shaded region of the confusion matrix.
7. Q3: tweak the minimum gain parameter a bit. Report your change and the findings.
Does it improve or degrade model prediction accuracy? After you are done reporting,
reset minimum gain back to 0.1. (Minimum gain refers to the minimum reduction in
impurity before a node split will
Phase 5: Evaluation
1. Q1: What are the top two predictors? How do you know?
occur.)
Phase 6: Deployment
A model is not going to be useful if you don’t use it, right? Since Decision Tree is one of the Predictive Analytics techniques, we can use it to predict if the job function is appropriate when assigning new hires. This is usually in the Deployment Phase of CRISP-DM.
(1) Simple Prediction
1. Q1: What is the predicted job function for a person with the following scores? How did you arrive at the answer?
SOCIAL = 15
CONSERVATIVE = 16
OUTDOOR = 25
(2) Prediction of multiple employees in one shot
It will be quite cumbersome to follow the tree if there are many new hires to predict. Here we will enter the psychological assessments of five new hires in a CSV file and have Rapidminer predict all of them in one shot.
Please follow the steps below:
1. Show the screenshot of your complete Process View in the Word document. This represents the
result of model building and testing.
2. Create the following new records in Excel and save it as the CSV file Assignment 1 –
NewEmployees.csv. This is the prediction dataset that includes new hires that we wish to
predict the appropriate job functions that best fit them. Import it to Rapidminer and drag it to
your process design.
Note: You do NOT need to create the response variable ‘JOB_FUNCTION’ in this data set. That is the variable we want our model to predict.
Note: Don’t forget to double-check the spelling of your columns. Column names should exactly match (case, spelling, etc.) those of the columns in the original training data set.
3. Add Assignment 1 – NewEmployees.csv to your model. Create the second Apply Model
operator to predict it.

a. The two output ports of this second Apply Model are connected to result ports.
b. What about its first input port? It expects the model (mod) that we have built in
previous sections. How do you send the model to this Apply Model? (Hint: the first
Apply Model operator outputs our model.)
4. Show the screenshot of your final Process View AND the predicted result.
5. Save this process file as Assignment 1a.rmp.
6. This technique of performing prediction can be used for any supervised learning
models, including ensemble methods (section 4.7 in the book), regression, logistic
regression, and other classification & regression models. Please keep a note of it. It
will be very useful next time when you wish to perform predictions using a verified model.
Section 2: K-Nearest Neighbors (K-NN) Method
Please complete the requirements of CRISP-DM phases 4 – 6 as illustrated in the previous section, but for K-Nearest Neighbors this time. Perform normalization. Set your k to 5 and weighted. Save this process file as Assignment 1b.rmp.
Comments