R Visualization Homework Help | Visualization Using ggplot()
- realcode4you
- Aug 4, 2021
- 3 min read
Load and clean data
# Load libraries
library(tidyverse)  # For ggplot, dplyr, and friends
library(readxl)     # For reading Excel files
library(lubridate)  # For working with dates
What is tidyverse?
The tidyverse is an opinionated collection of R packages designed for data science. All packages share an underlying design philosophy, grammar, and data structures.
Install the complete tidyverse with:
install.packages("tidyverse")What is readxl?
The readxl package makes it easy to get data out of Excel and into R. Compared to many of the existing packages (e.g. gdata, xlsx, xlsReadWrite) readxl has no external dependencies, so it’s easy to install and use on all operating systems. It is designed to work with tabular data.
Install the complete readxl with:
install.packages("readxl")What is Lubridate?
Lubridate is an R package that makes it easier to work with dates and times.
Download Dataset
Click here to download dataset
Read Data From Excel
# Load the original Excel file
data <- read_excel("data/360-giving-data.xlsx")
bbc <- data %>%
# Extract the year from the award date
mutate(grant_year = year(`Award Date`)) %>%
# Rename some columns
rename(grant_amount = `Amount Awarded`,
grant_program = `Grant Programme:Title`,
grant_duration = `Planned Dates:Duration (months)`) %>%
# Make a new text-based version of the duration column, recoding months
# between 12-23, 23-35, and 36+. The case_when() function here lets us use
# multiple if/else conditions at the same time.
mutate(grant_duration_text = case_when(
grant_duration >= 12 & grant_duration < 24 ~ "1 year",
grant_duration >= 24 & grant_duration < 36 ~ "2 years",
grant_duration >= 36 ~ "3 years"
)) %>%
# Get rid of anything before 2016
filter(grant_year > 2015) %>%
# Make a categorical version of the year column
mutate(grant_year_category = factor(grant_year))
Histograms
ggplot(data = bbc, mapping = aes(x = grant_amount)) +geom_histogram()
ggplot(data = bbc, mapping = aes(x = grant_amount)) +geom_histogram(binwidth = 100000)
ggplot(data = bbc, mapping = aes(x = grant_amount)) +geom_histogram(binwidth = 500)
ggplot(data = bbc, mapping = aes(x = grant_amount)) +geom_histogram(binwidth = 10000, color = "white")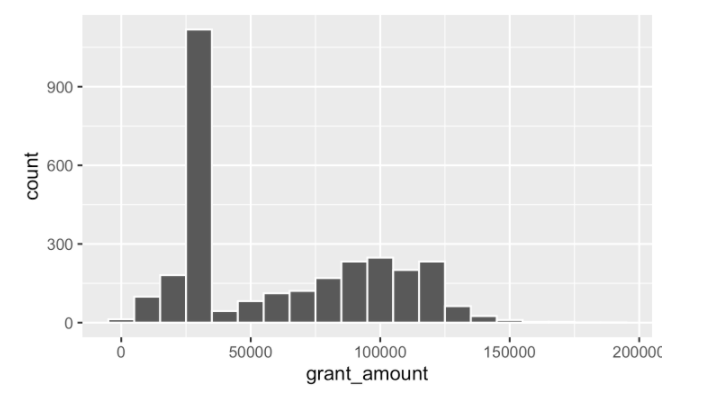
ggplot(bbc, aes(x = grant_amount, fill = grant_year_category)) +geom_histogram(binwidth = 10000, color = "white") +facet_wrap(vars(grant_year))
Points Graph
ggplot(bbc, aes(x = grant_year_category, y = grant_amount)) +geom_point()
ggplot(bbc, aes(x = grant_year_category, y = grant_amount)) +geom_point(position = position_jitter())
ggplot(bbc, aes(x = grant_year_category, y = grant_amount, color = grant_program)) +geom_point(position = position_jitter(height = 0))
Boxplots
ggplot(bbc, aes(x = grant_year_category, y = grant_amount, color = grant_program)) +geom_boxplot()
Summaries
Summarized datasets with dplyr functions like group_by() and summarize() and plot those.
bbc_by_year <- bbc %>%group_by(grant_year) %>%  # Make invisible subgroups for each yearsummarize(total = sum(grant_amount),  # Find the total awarded in each group
            avg = mean(grant_amount),  # Find the average awarded in each group
            number = n())  # n() is a special function that shows the number of rows in each group# Look at our summarized data
bbc_by_year
Output
## # A tibble: 4 x 4
##   grant_year    total    avg number
##        <dbl>    <dbl>  <dbl>  <int>
## 1       2016 17290488 78238.    221
## 2       2017 62394278 59765.   1044
## 3       2018 61349392 60205.   1019
## 4       2019 41388816 61136.    677
Now we plot the these
# Plot our summarized dataggplot(bbc_by_year, aes(x = grant_year, y = avg)) +geom_col()
If you need any programming assignment help in R programming, R project or R homework or need solution of above problem then we are ready to help you.
Send your request at realcode4you@gmail.com and get instant help with an affordable price.
We are always focus to delivered unique or without plagiarism code which is written by our highly educated professional which provide well structured code within your given time frame.
If you are looking other programming language help like C, C++, Java, Python, PHP, Asp.Net, NodeJs, ReactJs, etc. with the different types of databases like MySQL, MongoDB, SQL Server, Oracle, etc. then also contact us.


Comments