How to Implement Image Processing and Analysis using Python's Machine Learning
- realcode4you
- Nov 28, 2023
- 4 min read
Before start work with image processing and analysis using python, first we need to learn about below packages, programming language and IDE's that is important part of each ML projects.
In this blog we will only practice image processing analysis using python programming language.
Introduction to Python.
Core Packages.
Anaconda & Jupyter Notebooks
Google Colaboratory (Colab)
General CV Development Environment
pillow, scikit-image & OpenCV
Python programming language
lets you work more quickly and integrate your systems more effectively.
widely used high-level programming language for general-purpose programming,
express concepts in fewer lines of code
run on a wide variety of systems
easy integration of external packages
Core Packages
NumPy: NumPy is the fundamental package for scientific computing with Python.
Matplotlib: Python 2D plotting library which produces publication quality figures.
SciPy: Python-based ecosystem of open-source software for mathematics, science, and engineering.
Pandas: open source, BSD-licensed library providing high-performance, easy-to-use data structures and data analysis tools for Python.
Pillow / PIL: PIL is the Python Imaging Library; Pillow is the friendly PIL fork.
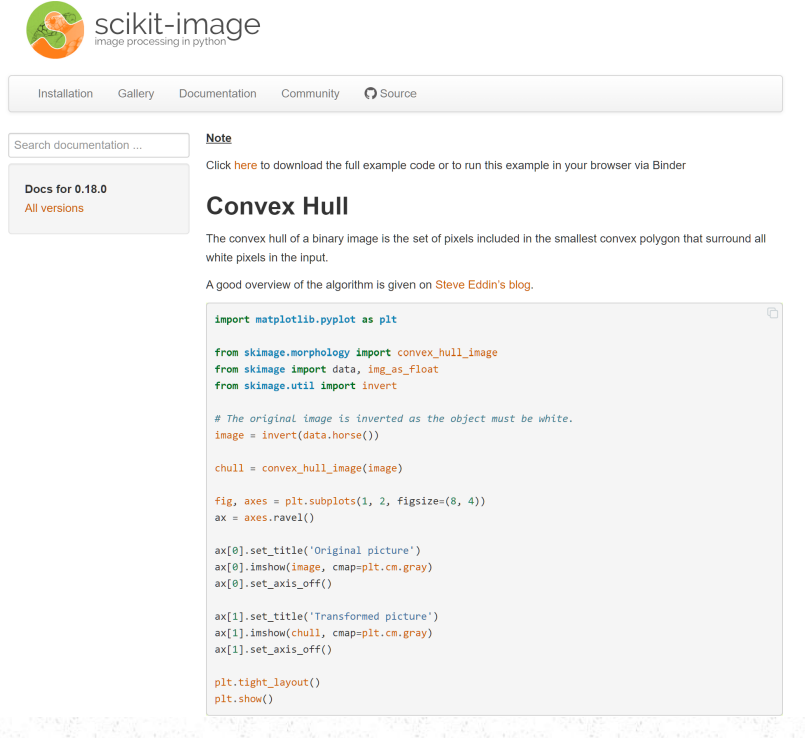
scikit-image: comprehensive collection of algorithms for image processing and analysis.
OpenCV: (Open Source Computer Vision Library) is an open source computer vision and machine learning software library. Designed for computational efficiency and with a strong focus on real-time applications.
# calculate the average of three input values.
# avg_script.py
# Get three test score
round1 = int(input("Enter score for round 1: "))
round2 = int(input("Enter score for round 2: "))
round3 = int(input("Enter score for round 3: "))
# Calculate the average
average = (round1 + round2 + round3) / 3
# Print out the test score (limit to two decimal places)
print("The average score is: ", "%.2f" % average)
Output Result:
Enter score for round 1: 12
Enter score for round 2: 36
Enter score for round 3: 32
The average score is: 26.67

Jupyter Notebooks
open-source web application that allows you to create and share documents that contain live code, equations, visualizations and explanatory text


Google Colab - Jupyter Notebooks


Pillow - Python Imaging Library (PIL) Fork


scikit-image
scikit-image is an image processing toolbox for SciPy (scientific computing in Python) - free - user guide – github source code – excellent support.

scikit-image example: Add noise to an image and then apply filtering based noise reduction.


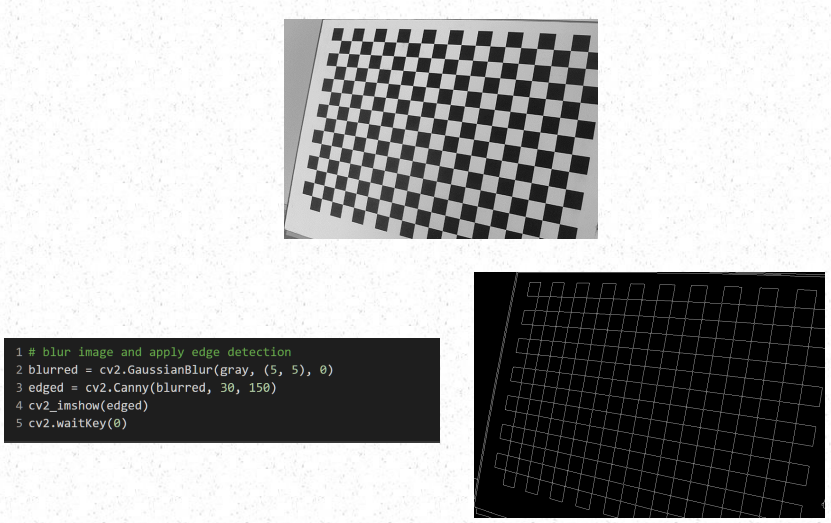
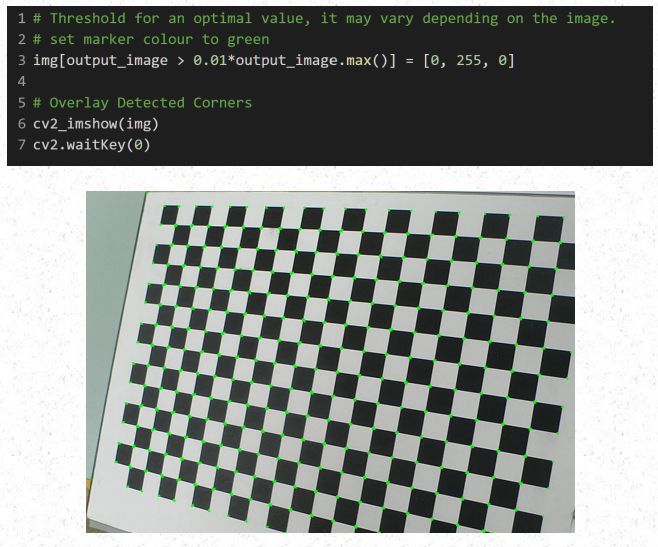
OpenCV
OpenCV (released under a BSD license): free for both academic and commercial use. Focus: real-time image processing
It has C++, C, Python and Java interfaces and supports Windows, Linux, Mac OS, iOS and Android (written in C/C++, but Python bindings)
OpenCV 4: DNN module, Intel Inference Engine backend (OpenVINO™):


example_1.ipynb
Task: Load in a sample colour image (e.g. birds.jpg) into PYTHON and convert it to a grey scale image. Display both the colour and grey scale images, along with the maximum/minimum and mean greyscale values in the image.
Basic Steps:
mount local drive and load file
load colour input image
display colour image
convert image to grey scale
display max/min/mean greyscale values along with the original and grey scale image


example_2.ipynb
Task: Find and highlight the largest (by area) coin in the image (coins_c.jpg). Display the centroid and the area of the region found.
Design Principal: Use a data driven thresholding and labelling strategy to find and isolate the biggest white region in the image.

Basic Steps (pseudo code):
Load the input image (coins_c.jpg). Convert it to greyscale to allow further processing. Apply noise reduction [Low pass (Gaussian) filter is applied to the image to remove noise so that the data driven thresholding stage operates more efficiently. This also has the effect of blurring the image].
We use a data driven threshold (Otsu) to separate out the regions of interest, the resultant image is binary.
Clean the image to remove smaller binary blobs. Dilate the image to strengthen the image signal.
Label (Shade the output image so that each binary blob is given a separate intensity value (grey level patch)) the image and measure its associated properties [we are mainly interested in the area and centroid values].
Extract and display the biggest blob area/centroid values. [Sort the region properties list by area (ascending). Extract area/centroid values from first (index 0) entry (i.e. largest) in our generated region properties list and display].
Segment the biggest binary blob region in the image and display.
Highlight the biggest blob region in the original image.


The four key stages in developing a solution are:
Outline the key steps of your approach. Identify the features that will allow you the greatest discrimination and/or analysis potential.
Based on the outline description, break the problem down into discrete stages i.e. noise removal, threshold calculation, edge detection... At each stage determining the best methodology/algorithm for the task at hand.
Implement your details solution in software. This requires mapping the higher level description detailed in step 2 to your software environment.
Test the solution – if the solution is not providing the correct results or is not sufficiently robust, go back to 2 and re-examine each element of your modular solution. If the solution is fatally flawed go back to step 1 and reconsider your assumptions. Test, test and test again...


Comments